Date: Wed May 16th - 6:30PM
Location: Hamilton Township Municipal Building
Quote from the Mayor: "The meeting is a follow-up to the information on the dam and flood we were presented Monday. I think we and the public found it disturbing and unacceptable. I want to move forward as soon as possible with corrective action. The public was left with all the mistakes and deficiencies and must feel insecure. We need to take action to correct the issues raised and take control of an out of control situation. "
Monday, May 14, 2007
Special Meeting set for Wednesday night on the Lenape Dam
Thursday, May 10, 2007
Why Did The April Flood Occur? The Numbers Don't Lie
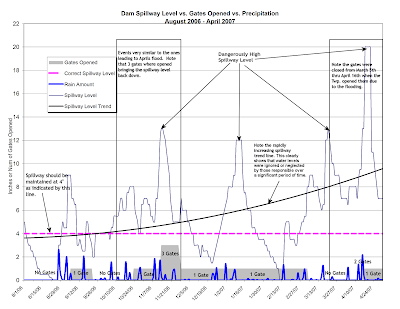
There have been several press articles written with verbiage in them indicating that the management of the dam had nothing to do with the flooding that occurred. At Mondays 5/7/07 Hamilton Twp Committee Meeting there were several handouts dealing with the Lake Lenape Dam and the April flood. One of those was the "Lenape Dam Log sheet" with logs from 8/06 - 4/07. Each day, except on weekends, holidays, and days off the operator of the dam checks the depth of the water at the spillway which should be maintained at 4" and opens or closes the 3 gates accordingly. The information then gets recorded in the log. Glancing over the March and April data at the meeting, it seemed quite apparent that the depth at the spillway was not being managed well at all. The gates of the dam had been closed for a 1 1/2 months allowing the water level at the spillway to get dangerously high, on March 20th it was at 13" and there was no action taken. This neglect and the fact that I have yet to read anything in the press suggesting that Township is responsible for this horrible event prompted me to do a little research of my own. I took 9 months of data from the Lenape Dam Log sheet as well as historical precipitation data from the National Weather Service and plugged it into a spreadsheet. While it is tricky to process 9 months of raw numbers in your head, plotting those numbers detailed a very disturbing trend that ultimately led to Aprils Flood. Click on the graph above to view in in full size, try printing it in landscape mode if you want a hard copy. I do apologize for it being a bit busy, however please take the time to understand it and come to your own conclusion. Take note of Oct. - Nov. where there was significantly more rain than what caused the April flood, all three gates were opened and the level at the spillway went down. Also take note how the spillway level bounces all over the place showing no consistency what so ever. Mark
Tuesday, May 8, 2007
Tuesday, May 1, 2007
Hamilton Twp. Committee Meeting (Lenape Dam on Agenda)
Date: Monday May 7th - 6:30PM
Location: Cologne Fire House (view map)
On the agenda will be Lake Lenape Dam issues of repair, maintenance, and responsibility. Atlantic County officials will be on hand as well.
Press Articles About April Nor'Easter Flooding
Floods recede, leaving worries behind in Hamilton
Lake Lenape dam couldn't prevent flooding
Residents question whether action at Lake Lenape should have happened sooner
Waters still rising in sections of Atlantic County
Flooding problems persists in Atlantic and Cumberland counties>
Swamps take over in Mullica, Hamilton
Subscribe to:
Posts (Atom)

